News
Tuesday
May292018

"Curve" Your Enthusiasm?

When I was starting out in the financial planning business, I used to listen to smart people who spewed out catchy phrases like "inverted yield curve", "risk-free rate", and "henway". Back then, I didn't really understand much of the lingo, so I was fortunate that all this "gibberish" was only a web-search away. In my discussions these days, I try and avoid jargon as much as possible and strive to distill financial concepts into their simplest components. Today is one such attempt to explain the inverted yield curve and its effect on the economy and markets.

This so-called "best" indicator of a future recession, the inverted yield curve, is not perfect and doesn’t provide an exact time or date. But economists have found that an inverted yield curve can be a warning sign of an economic downturn to come.

Again, an inverted what??? The yield curve is a line graph of the yield (i.e., interest rate) of treasury bills (bonds) from the very short term—one month, three months, six months, 1, 2, 3, 5, 7, 10 and all the way out to 30 years. A normal curve is sloped upward—for obvious reasons: the longer the maturity of the bond, the more the borrower should have to pay to compensate you for the risks of inflation and future interest rate movements. The 3-month treasury bill should pay at least incrementally more than the 1-month treasury bill, and on up the maturity range.

Deviations from this obvious hierarchy, called "inversions", are rare—as it turns out, just about as rare as recessions. This would be akin to walking into a bank and accepting a lower interest rate on a 2-year certificate of deposit (CD) than on a 1-year CD. Few would ever do that (especially since the penalties for early withdrawal are a bit steep).

Since 1955, long-term bonds yielded less than short-term ones before every single U.S. recession. Nobody knows exactly why a spate of market illogic should be followed by economic pain; there are theories, but the cause/effect is uncertain.

Unfortunately, the inversions in the past have occurred anywhere from 6 months to 24 months before the actual recession, so this is not exactly a precise timing mechanism. But perhaps we should consider the next yield inversion as a time to buckle our seat belts on the investment roller coaster.

Yield Curve Movement 2018-05-26

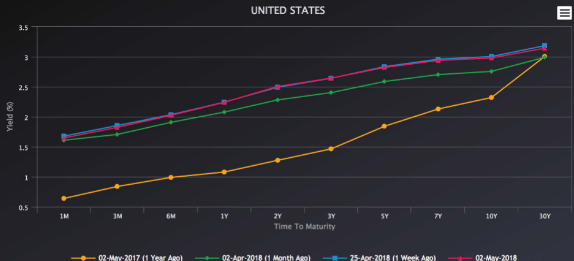
So where are we now? The above chart shows the current yield curve (red) compared with a week ago (blue), a month ago (green) and a year ago (orange). As you can see, the curve has flattened in the past 12 months, not to the point of inversion, but certainly a narrower spread (i.e., difference between yields). If you want to watch to see if there is further flattening, here’s one website that tracks the curve in real-time: https://www.bondsupermart.com/main/market-info/yield-curves-chart.

Now, when someone utters the phrase "inverted yield curve", you can nod in understanding. And if they ask what's the risk-free rate, you can tell them it's the current yield on the 10-year treasury note.

Finally, if anyone asks "what's a henway", you tell them "oh, a hen weighs about three or four pounds".

If you would like to review your current investment portfolio or discuss any other financial planning matters, please don’t hesitate to contact us or visit our website at http://www.ydfs.com. We are a fee-only fiduciary financial planning firm that always puts your interests first. If you are not a client yet, an initial consultation is complimentary and there is never any pressure or hidden sales pitch. We start with a specific assessment of your personal situation. There is no rush and no cookie-cutter approach. Each client is different, and so is your financial plan and investment objectives.

Sources:

https://www.bondsupermart.com/main/market-info/yield-curves-chart

https://www.forbes.com/sites/johnmauldin/2018/05/01/almost-all-recessions-began-6-to-24-months-after-the-yield-curve-inverted/#2550ecfa6742

 https://thefelderreport.com/2018/04/26/how-the-flattening-yield-curve-could-lead-to-a-bear-market-for-stocks/

The MoneyGeek thanks guest writer Bob Veres for his contribution to this post

Sunday
May062018

The Present Doesn't Portend the Future

You probably know the well worn disclaimer in the investing world, "past performance is no guarantee of future results." It's essentially how many investment firms wow you with statistics about their past performance, only to remind you that your future results may never match theirs. OK, fair enough, so how about present circumstances? Do they portend the future?

It's human nature to focus more on the present than the future, which is in line with our basic instinct of survival. After all, if we don't take care of the here and now, there may not be a future, right?

Marketing departments know this! Many things in life are about experiencing pleasure today, and pushing the cost of that pleasure into the future (credit cards anyone?). Drive off with the car with zero dollars down, and pay over 84 months. Go ahead--have another piece of cake - you can work it off later. No problem.

Many decisions investors face have similar tradeoffs. Buy a new car, or put more money into retirement? Take another vacation or fund the college account? And the further out the consequence, the less weight we tend to give to it. This is because we have a hard time imagining the future…especially way into the future.

Smart Today May Not Be Smart Tomorrow

We tend to extrapolate the present into the future, as if things will never change and will continue the status quo.

In the financial crisis of 2008-2009, many people were selling after experiencing financial losses. Some of that selling came just weeks before the market hit bottom. What would cause an investor, who desires to buy low and sell high, to sell after experiencing significant (yet unrealized) losses (i.e. sell low)? One factor is that they were extrapolating the present into the future…they couldn’t see how things would change.

Another great example is the German Bund (treasury bond). In 2016, Germany sold the 10-year Bund at a negative yield (this means that buyers were guaranteed to get back less principal than they originally put in). Those investors were certain that rates would continue going negative for the next 10 years. But here we are almost two years later and the current yield is already over +0.50%. Substantial money (principal) may be lost on this bond simply because investors extrapolated the "present of 2016" into the future.

More recently, the stock markets have struggled to continue the torrid advance that began with the presidential election in 2016, lasting through this past January. The markets had a handful of "1% days" during a low volatility year in 2017, yet so far in 2018, we've had more 1% days than all of 2017 as volatility has returned. While the markets haven't yet closed more than 10% from their January peak, you've probably read or heard the prognosticators calling this correction the beginning of the end for the bull market. Enough investors will be scared witless of enduring another 2008-2009 selloff that they'll sell now and probably miss the next great advance that makes another new all-time high sooner than they can presently imagine.

History May Help Here

Think about everything that has happened in the last 10 years--of course, a lot has happened. And while we may not be able to project what will happen in the future, how it will happen or when, we know – through the history of mankind - that lots of unexpected things will occur. Another crisis is always bound to come along.

The plans that we have developed for our clients prepare them for many different scenarios. They take into account their risk tolerance, time-frame and overall monetary goals and dreams.  But we don’t have to get any one scenario right. We just need to be disciplined enough to stick with the plan through both the good and the tough times.

If you would like to review your current investment portfolio or discuss any other financial planning matters, please don’t hesitate to contact us or visit our website at http://www.ydfs.com. We are a fee-only fiduciary financial planning firm that always puts your interests first. If you are not a client yet, an initial consultation is complimentary and there is never any pressure or hidden sales pitch. We start with a specific assessment of your personal situation. There is no rush and no cookie-cutter approach. Each client is different, and so is your financial plan and investment objectives.

Source: Information obtained from The Emotional Investor

Monday
Apr302018

Trade War, What is it Good For?

"War, what is it good for? Absolutely nothing!" - from the 1969 song "War" by Edwin Starr

When most of us hear talk about something described as a “war,” we intuitively recognize that there could be very unpleasant outcomes on all sides. Wars have one thing in common: there is seldom a clear-cut “winner” amid the damage and destruction.

So when President Trump declares a “trade war” against the world’s second-largest economy, it’s natural that many people—including, apparently, a large number of investors—would feel spooked about what’s to come in our collective future. This explains why every escalation of words, and new lists of things that will be taxed at U.S. and Chinese borders, has provoked sharp downturns in the markets.

But what, exactly, is a “trade war?” Beyond that, what is a “trade deficit” and why are we trying to “cure” America’s trade deficit with China?

To take the latter issue first, every bilateral trade deficit is simply a calculation, made monthly by government economists, that adds up the value of products manufactured in, say, China, that are purchased in, say, the U.S. (Chinese exports or U.S. imports), and subtracts the value of products manufactured in the U.S. that are purchased by Chinese consumers (U.S. exports or Chinese imports). The first thing to understand is that this is not a very precise figure. To take a simple example, Apple manufactures its iPhones in southern China, ships them to the U.S. for sale, and the value of each of the millions of smart phones is counted as a Chinese export to the U.S. market. Apple reaps extraordinary profits, but this is considered a net negative in terms of U.S. trade.

Moreover, the full value of each iPhone is considered on the import ledger, without subtracting out the value of the “services” that Apple provides. The software and design were, after all, created in the U.S., and are a large part of the value of the phones that people become so addicted to. But these financially valuable aspects of the phone, made in America, are not reflected in the trade numbers.

Beyond that, many economists question whether a trade deficit is a bad thing in the first place. Chances are, you run a significant trade deficit with your local grocery store; that is, it brings to your neighborhood the food you put on the table, and you exchange money for it. You import food, but the grocery store doesn’t import a comparable amount of things you make in your garage. Are you materially harmed by this economic opportunity that takes dollars out of your pocket and puts them in the hands of the grocery store? If you were, you might take your business to the grocery store further up the road, and run a trade deficit with a different establishment.

How does this relate to the U.S./China trade relations? Simple mathematics indicate that Chinese manufacturers are taking dollars from U.S. consumers, but they have to do something with those dollars to balance the ledger. That money finds its way into purchases of U.S. debt (Treasury bonds) or reinvestment in the U.S. economy, buying real estate or investing in domestic companies.

You fight trade wars with tariffs, which are simply a government tax on specific items when they cross the border. So when the Trump Administration announces the list of 1,300 different products that will become the targets of its tariff plan, that means that anyone buying those products will see their taxes go up—invisibly, in a higher cost of living.

The bigger potential damage comes when China retaliates in kind, and certain sectors of the U.S. economy have to pay the Chinese government a tariff for the privilege of selling their products to the Chinese market. China represents 15-20 percent of Boeing’s commercial airline sales, so a proposed 25% tariff could sting. More directly impacted are U.S. farmers. Soybeans represent the largest agricultural export from the U.S. to China ($14.2 billion worth of shipments in 2016, about one-third of the U.S. crop), and the Chinese consume a lot of U.S.-raised pork. When the tariffs were announced, pork futures dropped to a 16-month low, and soybean futures fell 5% overnight.

The larger concern is that China is preparing to shift its sourcing of agricultural products from the U.S. to Brazil and Argentina, and the retaliatory tariff makes this economically attractive for Chinese consumers. Will that business ever come back again?

If this has you worried, or searching China’s latest list to see which stock might be impacted as the rhetorical trade war escalates, it might be helpful to take a step back. So far, none of these tariffs have been levied; no actual shots have been fired in the trade war, which means it is not yet a “war” at all. The U.S. and China are trading retaliatory lists of potential targets, and there is some escalation in the value and extent of those lists. But when it comes time to actually fire those shots, the most likely scenario is a generous compromise that leaves us with the status quo.

Remember how worried the markets were when the Trump Administration abruptly announced new levies against global steel and aluminum imports? It turned out to be mostly bluster. A full 50% of all U.S. steel imports, from Brazil, South Korea, Mexico, Canada and others, were exempted from those tariffs. Larry Kudlow, the White House’s new economic advisor, said several times last week that there would be, in fact, no new tariffs, and no trade war with China. It will be months before any of the proposed tariffs could be put into place, which is plenty of time for Kudlow’s prediction to come true—and make all the panic sellers who drove down stock prices look a little bit silly.

If you would like to review your current investment portfolio or discuss any other financial planning matters, please don’t hesitate to contact us or visit our website at http://www.ydfs.com. We are a fee-only fiduciary financial planning firm that always puts your interests first. If you are not a client yet, an initial consultation is complimentary and there is never any pressure or hidden sales pitch. We start with a specific assessment of your personal situation. There is no rush and no cookie-cutter approach. Each client is different, and so is your financial plan and investment objectives.

Sources:

https://www.politico.com/magazine/story/2018/04/07/how-to-win-trade-war-china-217830

http://www.slate.com/articles/business/the_edgy_optimist/2014/03/u_s_china_trade_deficit_it_s_not_what_you_think_it_is.html

https://www.forbes.com/sites/timworstall/2016/12/16/apples-service-exports-mystery-and-why-the-trade-deficit-simply-does-not-matter/#247c14b13934

https://www.desmoinesregister.com/story/money/business/2018/04/06/futures-file-trade-war-looms-soybean-prices-unscathed-now/493685002/

The MoneyGeek thanks guest writer Bob Veres for his contribution to this post

Sunday
Apr222018

Is the Bull Market Finally Over?

After more than a year of historically low volatility, January markets came in like a lamb and went out as a lion, and the lion has stuck around so far. It's safe to say that volatility is here to stay for awhile, prompting most people to ask:

Is the bull market finally over?

For the first time in nine calendar quarters, the U.S. investment markets delivered a negative overall return. It was only a slight decline, but the decline reminds us that markets can and do go down from time to time.

After starting the year strong, the Wilshire 5000 Total Market Index—the broadest measure of U.S. stocks—finished the quarter down 0.76%. The comparable Russell 3000 index was down 0.64% for the first three months of the year.

Large cap stocks posted identical small losses. The Wilshire U.S. Large Cap index dropped 0.76% in value, while the Russell 1000 large-cap index fell 0.69%. The widely-quoted S&P 500 index of large company stocks dropped 1.22% in value during the year’s first quarter. Meanwhile, the Russell Midcap Index fell 0.46% in the first three months of the year.

As measured by the Wilshire U.S. Small-Cap index, investors in smaller companies posted a 0.73% loss over the first three months of the year. The comparable Russell 2000 Small-Cap Index lost a bit of ground as well, falling 0.08% for the quarter. The technology-heavy Nasdaq Composite Index finished the quarter with a gain of 2.33%, making technology the standout performer of the year so far.

International stocks are fully participating in the downturn. The broad-based MSCI EAFE index of companies in developed foreign economies lost 2.37% in the recent quarter. In aggregate, European stocks were down 2.57% over the last three months, while MSCI’s EAFE’s Far East Index lost 0.67%. Emerging market stocks of less developed countries, as represented by the MSCI EAFE EM index, gained a meager 0.93% in dollar terms in the first quarter.

Looking over the other investment categories, real estate, as measured by the Wilshire U.S. REIT index, fell 7.42% during the year’s first quarter. The S&P GSCI index, which measures commodities returns, gained 2.37% in the first quarter.

In the bond markets, coupon rates on 10-year Treasury bonds have continued a slow but steady rise to 2.75%, while 30-year government bond yields have fallen slightly to 2.97%. Five-year municipal bonds are yielding, on average, 2.06% a year, while 30-year munis are yielding 3.01% on average.

What’s going on? The first quarter saw the first correction—that is, a decline of more than 10%--in three years, which dragged returns down from a roaring start to the year. Industry pundits have many triggering effects to point to, from chaos in the White House to the possibility of a global trade war, to fears of inflation or higher interest rates, to the simple fact that U.S. stocks have been priced much higher than their historical averages. They aren’t getting much explanatory data from the economic statistics; the unemployment rate is testing record lows and new jobs are being created at record levels. More importantly, annual earnings estimates for S&P 500 companies rose 7.1% during the first three months of the year—the fastest rise since FactSet began keeping track in 1996.

Ironically, the small downturn plus the jump in earnings may have forestalled a bigger corrective bear market later. The S&P 500, by some measures, is now trading at 16.1 times projected earnings for the next year, compared with 18.6 in late January when the markets were extraordinarily bullish. Stocks are not as overpriced as they once were, and the corporate tax cut could lead to higher reported earnings throughout the year.

Some are questioning whether the large cap indices fully reflect the overall U.S. economy these days. As mentioned earlier, the technology sector is generating positive returns. If you were to take Amazon.com, Microsoft, NetFlix, NVIDIA Corp., Cisco Systems and Apple, Inc. out of the S&P 500, the downturn would have been much worse, as companies like Procter & Gamble, Exxon Mobil and General Electric all lost value. As tech roars and more traditional companies see their shares losing value, technology makes up a greater portion of the capitalization-weighted indices, and its returns will have a higher impact in the future.

In any case, it appears that investors have become increasingly nervous about their stock investments. Over the past three months, the CBOE Volatility Index--the VIX index--widely known as Wall Street’s “fear gauge,” posted its biggest quarterly rise since the third quarter of 2011, jumping 81%. The VIX reflects option traders’ collective expectations for the S&P 500 index’s volatility over the coming 30-day period, and by this measure, traders had been very calm for the 18 months before early February. Now the VIX is at or near its historical average, which suggests that the equities markets are going to experience a totally normal bumpy ride going forward. This is a good time to fasten seat belts, and also consider whether you’d have the patience to ride out a bear market. We can’t predict when that will happen, of course, but I think everybody realizes that the bull market cannot last forever.

At this stage of the bull market, the strength in the economy (overheating?) and lack of major technical divergences prompt us to continue giving this bull the benefit of doubt. Yet, with a bull market long in the tooth, over-confident consumers, an unfavorable monetary climate, and some frothy optimism, the level of market risk today is high and rising. While a new bull market high may still lie ahead, now may be time to take incremental steps to prepare for the next major downturn, and that’s precisely what we’ve been doing in client portfolios this year. We've reduced market exposure and have increased our hedges as previously communicated. Further changes will depend on the evidence as it unfolds.

If you would like to review your current investment portfolio or discuss any other financial planning matters, please don’t hesitate to contact us or visit our website at http://www.ydfs.com. We are a fee-only fiduciary financial planning firm that always puts your interests first. If you are not a client yet, an initial consultation is complimentary and there is never any pressure or hidden sales pitch. We start with a specific assessment of your personal situation. There is no rush and no cookie-cutter approach. Each client is different, and so is your financial plan and investment objectives.

Sources:

Wilshire index data: http://www.wilshire.com/Indexes/calculator/

Russell index data: http://www.ftse.com/products/indices/russell-us

S&P index data: http://www.standardandpoors.com/indices/sp-500/en/us/?indexId=spusa-500-usduf--p-us-l--

Nasdaq index data:

http://quotes.morningstar.com/indexquote/quote.html?t=COMP

http://www.nasdaq.com/markets/indices/nasdaq-total-returns.aspx

International indices: https://www.msci.com/end-of-day-data-search

Commodities index data: http://us.spindices.com/index-family/commodities/sp-gsci

Treasury market rates: http://www.bloomberg.com/markets/rates-bonds/government-bonds/us/

Bond rates:

http://www.bloomberg.com/markets/rates-bonds/corporate-bonds/

General:

http://money.cnn.com/2018/04/01/investing/stocks-week-ahead-valuation/index.html

https://www.marketwatch.com/story/tech-is-responsible-for-nearly-all-of-the-markets-2018-advancedespite-facebooks-stock-woes-2018-03-22

https://www.marketwatch.com/story/the-simple-reason-the-dow-is-ending-a-9-quarter-win-streak-wall-streets-surging-fear-index-2018-03-29?link=MW_popular

The MoneyGeek thanks guest writer Bob Veres for his contribution to this post

Saturday
Apr072018

What’s Going on in the Markets April 7, 2018

Sandwiched between two "down" days in the markets this week (Monday and Friday), were three "up" days, culminating in an overall 1.4% weekly loss in the S&P 500 index. Fears of a full-blown trade war receded on Tuesday, resulting in a mid-week rally that eventually faded on Friday, as trade war fears resurfaced and weighed on the markets.

Despite the threats of a trade war, the outlook for the economy and corporate earnings, the fundamentals that truly drive the markets over the long term, both remain quite positive. Both surveys from the Institute for Supply Management (manufacturing and services) are firmly anchored in growth territory. And although yesterday’s monthly payroll report revealed that there were fewer jobs created in March (probably weather related), the unemployment rate remained unchanged at 4.1%.

The broad market indexes are fluctuating near their recent lows as the market correction (and volatility) continues to unfold. The typical market correction lasts roughly 12 to 16 weeks, and this one is about 11 weeks old. But there are signs that the market is in a final bottoming process that could potentially yield a multi-week or multi-month rally which could start any day now. Corrections never feel good while they’re happening, but they’re a healthy way of “digesting” past gains and to keep the markets from overheating after a prolonged period of going up. January was particularly strong this year, but all those gains and more have been surrendered during this correction.

During this correction, clients may have noticed increased trading activities in their accounts. Our standard practice at the start of and during a correction are to:

  • Raise cash levels by selling some profitable or underperforming positions.
  • Increase hedges (a hedge is risk reducing instrument) through the use of inverse funds (funds that go up when the market goes down) and options.
  • Adjust (short) options that were sold to take advantage of higher premiums and volatility, which results in additional portfolio income as we roll out to later months. Short options also act as hedges on the portfolio.
  • Use technical signals in the market to identify potential bottoms, to begin putting available cash to work in new (now lower cost) positions.
  • When uncertainty and risk are high, but opportunities present themselves, we may decide to limit client risk through the purchase of call options, or by selling put options, instead of purchasing outright shares. Both approaches increase exposure to the market with less risk than outright share purchases.
  • Identify spots where it is deemed prudent to remove or trim hedges to reduce their overall “drag” on the portfolio. Hedges that are removed may be re-instated if the markets unexpectedly turn back down, sometimes even a day or two later.
  • Monitor new positions purchased during the early stages of market recovery to ensure that these positions are “working”, keeping them on a short leash. All such positions are considered short-term until the market ultimately proves itself. Some positions that turn profitable but return to their buy point are sold for a small profit or small loss.

As the market showed signs of making a bottom early in the week, we were particularly active in reducing hedges and testing new positions. Because of Friday’s decline, unfortunately, we found ourselves reinstating some of those hedges and selling some of the newly established positions for a small profit.

Back to square one.

The process of market bottoming is an inexact science, much like the process of investing, so fits and starts are to be expected. As Friday’s decline gave back all the week’s gains and then some, we begin the process of looking for another market bottom next week.

During a correction (or outright bear market) our objectives remain to protect client capital first, and grow it second. Until safer market conditions present themselves, and volatility subsides, we will remain defensive and have a bit of an “itchy trigger finger” with new and existing positions.  We trust and hope that you agree with this approach, even if it increases the number of trades we make. Please excuse the extra trade confirmations that hit your in-box.

Next week kicks off the start of quarterly corporate earnings reporting season, wherein companies report their financial results for the first quarter of 2018. Estimates are that companies expect to report earnings that are on average 17% higher than the first quarter of 2017. If those results pan out as expected or better, we may be looking at this correction in the rear view mirror in a few weeks.

The dichotomy between a solid economy and a nervous, volatile market is a dilemma that requires patient discipline and an understanding of market history. It is still too early to determine if this is just a lengthy correction or if it could lead to a further decline and a full-blown bear market. Given the elevated risk and persistent volatility, however, it’s important to remain defensively positioned and to objectively evaluate key indicators as the evidence continues to unfold.

If you would like to review your current investment portfolio or discuss any other financial planning matters, please don’t hesitate to contact us or visit our website at http://www.ydfs.com. We are a fee-only fiduciary financial planning firm that always puts your interests first. If you are not a client yet, an initial consultation is complimentary and there is never any pressure or hidden sales pitch. We start with a specific assessment of your personal situation. There is no rush and no cookie-cutter approach. Each client is different, and so is your financial plan and investment objectives.